NOPTA dashboard report—February 2016
Applications in progress (number of days at current status)#
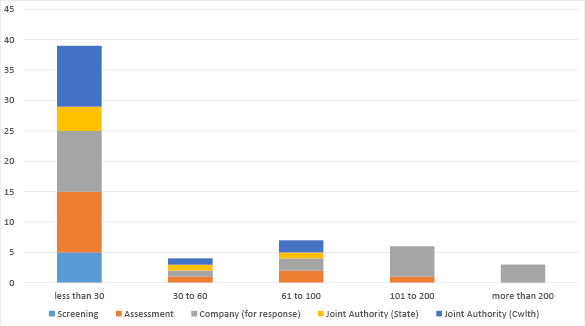
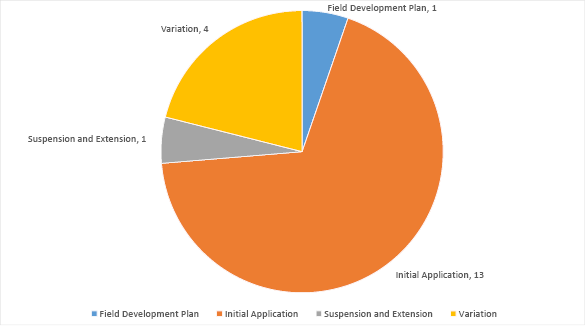
Number of applications with each Joint Authority member
| Application Type | Joint Authority (State) | Joint Authority (Cwlth) | Joint Authority Total |
|---|---|---|---|
| Field Development Plan | 1 | 0 | 1 |
| Initial Application | 5 | 8 | 13 |
| Suspension & Extension | 0 | 1 | 1 |
| Variation | 0 | 4 | 4 |
| Total | 6 | 13 | 19 |
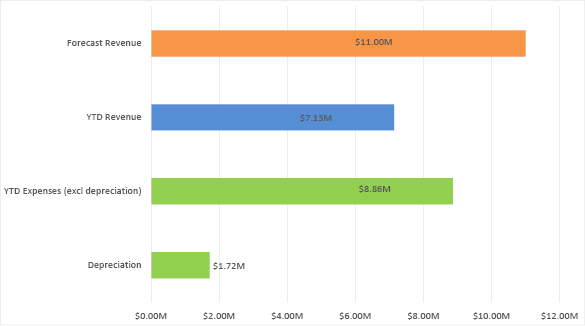
Finance $M
Completed applications
| Decision Maker | February 2016 Completed |
Complete YTD (Calendar Year) |
In Progress* |
|---|---|---|---|
| Applications for JA Decision | 11 | 29 | 50 |
| Applications for TA Decision | 7 | 13 | 11 |
| Commonwealth Minister (GHG) | 0 | 0 | 0 |
| Total | 18 | 42 | 61 |
Data submissions outstanding (last six months)
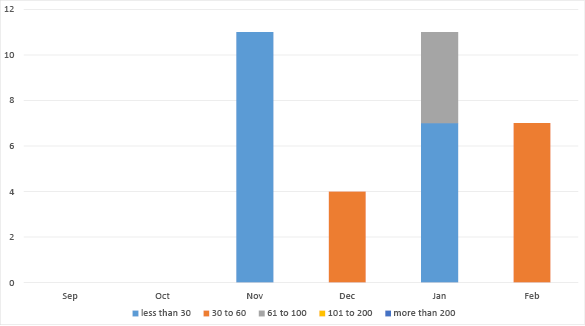
Data submissions outstanding February
| Activities | Less than 30 | 30 to 60 | 61 to 100 | 101 to 200 | more than 200 | Total |
|---|---|---|---|---|---|---|
| All Activities | 0 | 0 | 0 | 0 | 0 | 0 |
| All Wells | 0 | 0 | 0 | 0 | 0 | 0 |
| Wells (Basic) | 0 | 0 | 0 | 0 | 0 | 0 |
| Wells (Interp) | 0 | 0 | 0 | 0 | 0 | 0 |
| All Surveys | 0 | 7 | 0 | 0 | 0 | 7 |
| New Surveys (Basic) | 0 | 7 | 0 | 0 | 0 | 7 |
| New Surveys (Interp) | 0 | 0 | 0 | 0 | 0 | 0 |
Wells completed
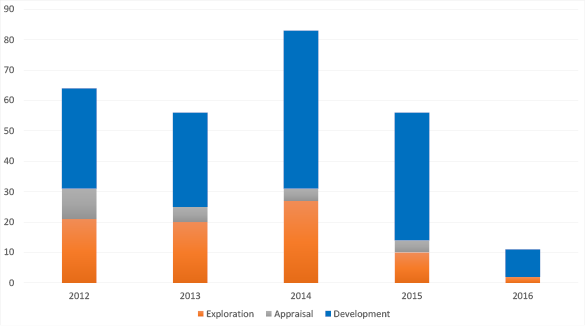
| Wells | 2014 | 2015 | Jan-16 | Feb-16 |
|---|---|---|---|---|
| Commenced | 73 | 56 | 7 | 3 |
| In progress | 13 | 10 | 9 | 6 |
| Suspended | 14 | 25 | 28 | 28 |
| Completed | 83 | 56 | 4 | 7 |
Surveys completed
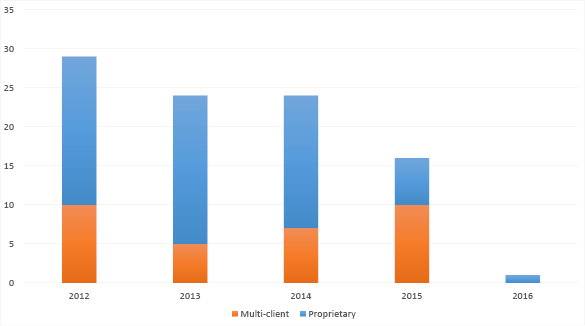
| Surveys | 2014 | 2015 | Jan-16 | Feb-16 |
|---|---|---|---|---|
| Commenced | 24 | 15 | 0 | 0 |
| In progress | 4 | 2 | 3 | 2 |
| Suspended | 1 | 0 | 0 | 0 |
| Completed | 22 | 16 | 0 | 1 |