NOPTA dashboard report—October 2015
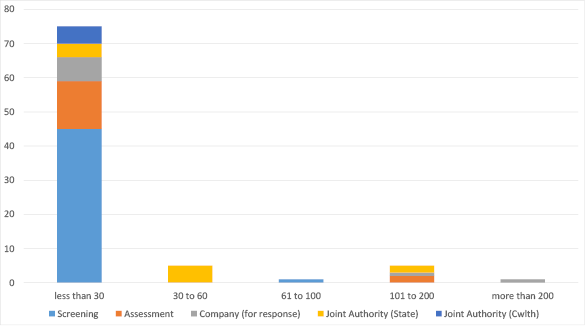
Applications in progress (number of days at current status)#
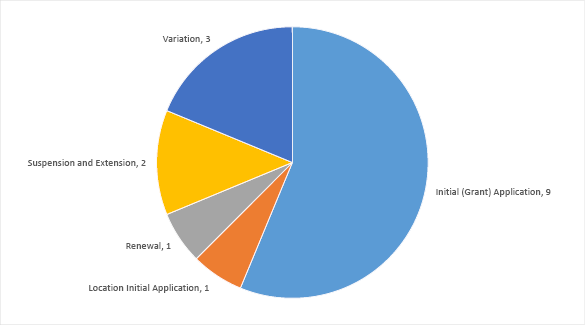
Number of applications with each Joint Authority member
| Application Type | Joint Authority (State) | Joint Authority (Cwlth) | Joint Authority Total |
|---|---|---|---|
| Initial (Grant) Application | 5 | 4 | 9 |
| Location Initial Application | 1 | 0 | 1 |
| Renewal | 1 | 0 | 1 |
| Suspension and Extension | 2 | 0 | 2 |
| Variation | 2 | 1 | 3 |
| Total | 11 | 5 | 16 |
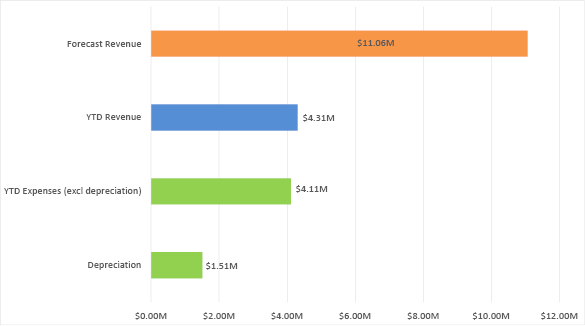
Finance $M
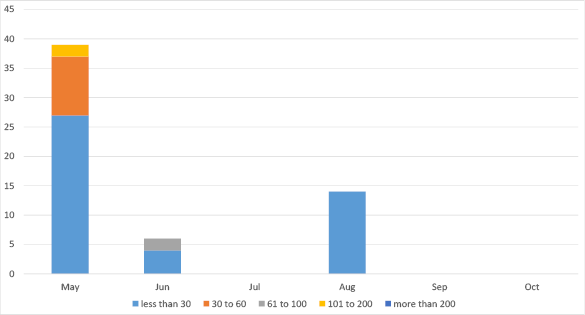
Completed applications
| Decision Maker | October 2015 Completed |
Complete YTD (Calendar Year) |
In Progress* |
|---|---|---|---|
| Applications for JA Decision | 24 | 253 | 93 |
| Applications for TA Decision | 19 | 323 | 21 |
| Commonwealth Minister (GHG) | 0 | 3 | 0 |
| Total | 43 | 579 | 114 |
Data submissions outstanding October
There were no data submissions outstanding this month.
Data submissions outstanding (last six months)
Wells completed
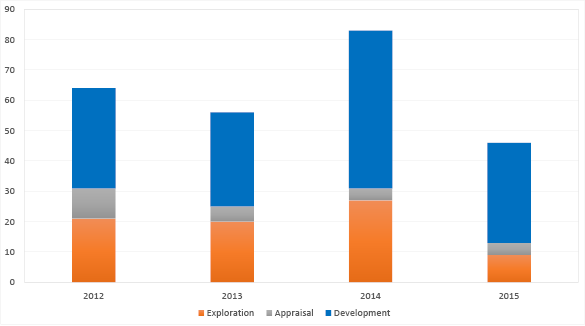
| Wells | 2014 | May-15 | Jun-15 | Jul-15 | Aug-15 | Sep-15 | Oct-15 |
|---|---|---|---|---|---|---|---|
| Commenced | 73 | 2 | 3 | 4 | 7 | 1 | 5 |
| In progress | 13 | 11 | 9 | 9 | 6 | 7 | 7 |
| Suspended | 14 | 21 | 10 | 15 | 18 | 18 | 18 |
| Completed | 83 | 1 | 14 | 3 | 7 | 1 | 4 |
Surveys completed
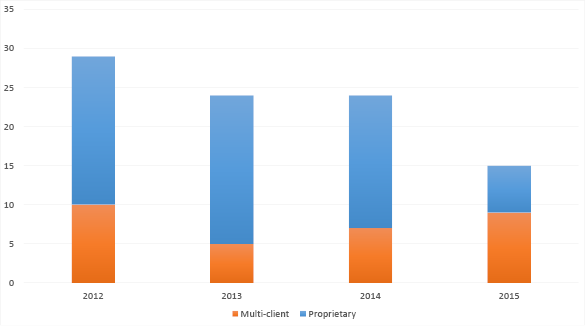
| Surveys | 2014 | May-15 | Jun-15 | Jul-15 | Aug-15 | Sep-15 | Oct-15 |
|---|---|---|---|---|---|---|---|
| Commenced | 24 | 1 | 4 | 2 | 0 | 0 | 0 |
| In progress | 4 | 2 | 2 | 2 | 2 | 2 | 2 |
| Suspended | 1 | 2 | 1 | 2 | 2 | 0 | 0 |
| Completed | 22 | 1 | 3 | 3 | 0 | 1 | 1 |