NOPTA dashboard report—June 2015
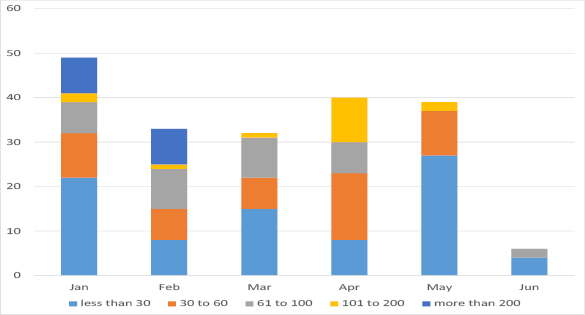
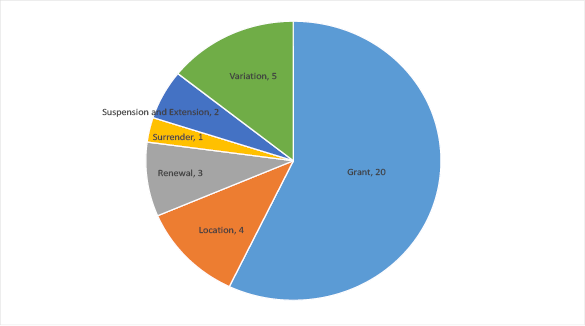
Applications in progress (days from date of submission)
Joint Authority for Decision
| Application Type | Joint Authority (State) | Joint Authority (Cwlth) | Total |
|---|---|---|---|
| Grant | 16 | 4 | 20 |
| Location | 3 | 1 | 4 |
| Renewal | 3 | 0 | 3 |
| Surrender | 1 | 0 | 1 |
| Suspension and Extension | 2 | 0 | 2 |
| Variation | 4 | 1 | 5 |
| Total | 29 | 6 | 35 |
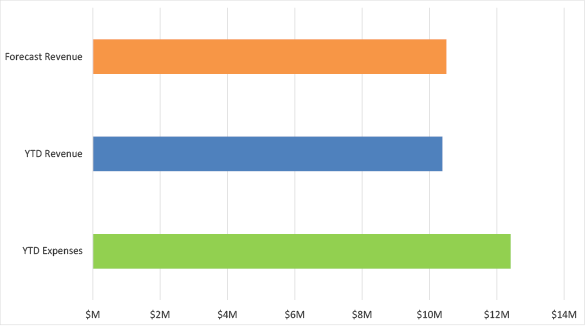
Finance $M
Completed Applications
| Decision Maker | April 2015 Completed |
May 2015 Completed |
June 2015 Completed |
Completed YTD |
|---|---|---|---|---|
| Applications for JA Decision | 25 | 24 | 23 | 116 |
| Applications for TA Decision | 3 | 16 | 28 | 184 |
| Commonwealth Minister (GHG) | 0 | 3 | 0 | 3 |
| Total | 28 | 43 | 51 | 303 |
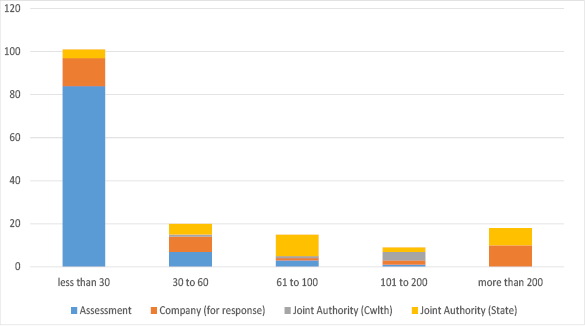
Data Submissions Outstanding June
| Activities | Less than 30 | 30 to 60 | 61 to 100 | 101 to 200 | more than 200 | Total |
|---|---|---|---|---|---|---|
| All Activities | 4 | 0 | 2 | 0 | 0 | 6 |
| All Wells | 0 | 0 | 0 | 0 | 0 | 0 |
| Wells (Basic) | 0 | 0 | 0 | 0 | 0 | 0 |
| Wells (Interp) | 0 | 0 | 0 | 0 | 0 | 0 |
| All Surveys | 4 | 0 | 2 | 0 | 0 | 6 |
| New Surveys (Basic) | 4 | 0 | 0 | 0 | 0 | 4 |
| New Surveys (Interp) | 0 | 0 | 2 | 0 | 0 | 2 |
Wells Completed
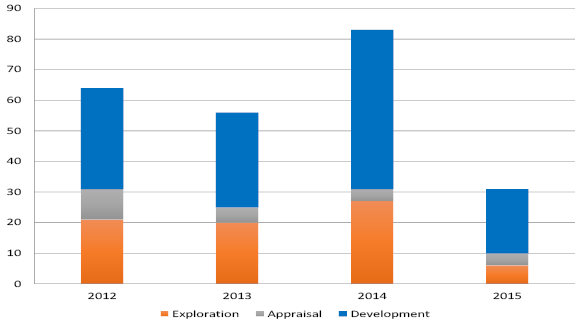
| Wells | 2014 | Jan-15 | Feb-15 | Mar-15 | Apr-15 | May-15 | Jun-15 |
|---|---|---|---|---|---|---|---|
| Commenced | 73 | 2 | 11 | 5 | 7 | 2 | 3 |
| In progress | 13 | 10 | 7 | 12 | 18 | 11 | 9 |
| Suspended | 14 | 12 | 10 | 11 | 12 | 21 | 10 |
| Completed | 83 | 5 | 5 | 4 | 2 | 1 | 14 |
Surveys Completed
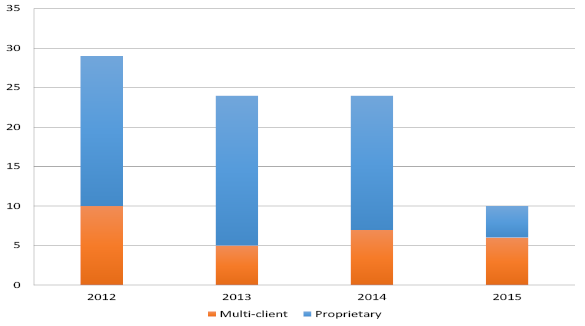
| Surveys | 2014 | Jan-15 | Feb-15 | Mar-15 | Apr-15 | May-15 | Jun-15 |
|---|---|---|---|---|---|---|---|
| Commenced | 24 | 3 | 0 | 2 | 2 | 1 | 4 |
| In progress | 4 | 2 | 5 | 4 | 3 | 2 | 2 |
| Suspended | 1 | 0 | 0 | 0 | 2 | 2 | 1 |
| Completed | 22 | 3 | 0 | 1 | 3 | 1 | 3 |
Data Submissions Outstanding (last six months)