NOPTA dashboard report—July & August 2015
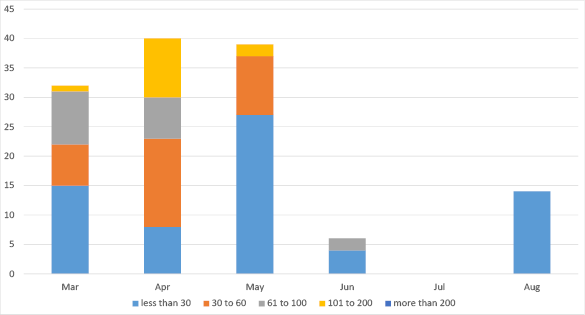
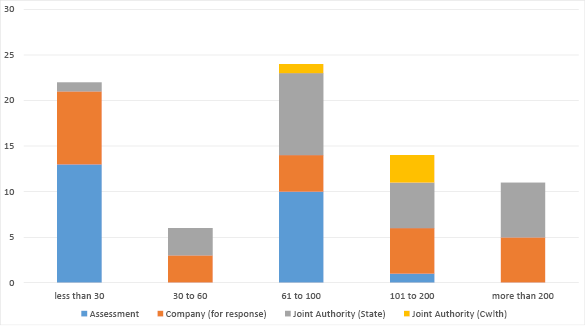
Applications in progress (number of days from when submitted)
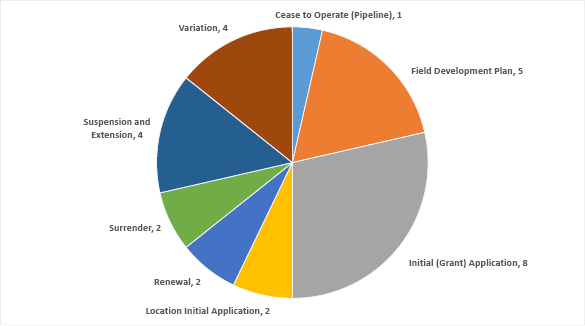
Number of applications with each Joint Authority member
| Application Type | Joint Authority (State) | Joint Authority (Cwlth) | Joint Authority Total |
|---|---|---|---|
| Cease to Operate (pipeline) | 1 | 0 | 1 |
| Field Development Plan | 5 | 0 | 5 |
| Initial (Grant) Application | 5 | 3 | 8 |
| Location Initial Application | 2 | 0 | 2 |
| Renewal | 2 | 0 | 2 |
| Surrender | 1 | 1 | 2 |
| Suspension and Extension | 4 | 0 | 4 |
| Variation | 4 | 0 | 4 |
| Total | 24 | 4 | 28 |
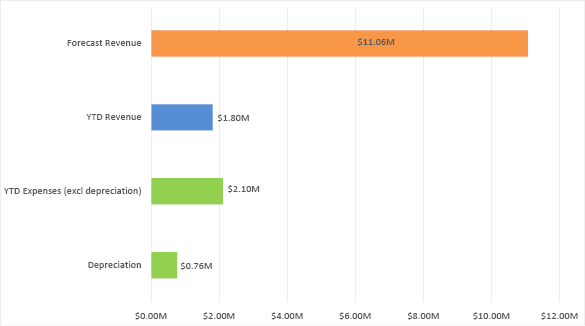
Finance $M
Completed Applications
| Decision Maker | August 2015 Completed |
Complete YTD (Calendar Year) |
In Progress* |
|---|---|---|---|
| Applications for JA Decision | 48 | 181 | 59 |
| Applications for TA Decision | 17 | 293 | 18 |
| Commonwealth Minister (GHG) | 0 | 3 | 0 |
| Total | 65 | 477 | 77 |
Data Submissions Outstanding August
| Activities | Less than 30 | 30 to 60 | 61 to 100 | 101 to 200 | more than 200 | Total |
|---|---|---|---|---|---|---|
| All Activities | 14 | 0 | 0 | 0 | 0 | 14 |
| All Wells | 0 | 0 | 0 | 0 | 0 | 0 |
| Wells (Basic) | 11 | 0 | 0 | 0 | 0 | 11 |
| Wells (Interp) | 0 | 0 | 0 | 0 | 0 | 0 |
| All Surveys | 0 | 0 | 0 | 0 | 0 | 0 |
| New Surveys (Basic) | 3 | 0 | 0 | 0 | 0 | 3 |
| New Surveys (Interp) | 0 | 0 | 0 | 0 | 0 | 0 |
Wells Completed
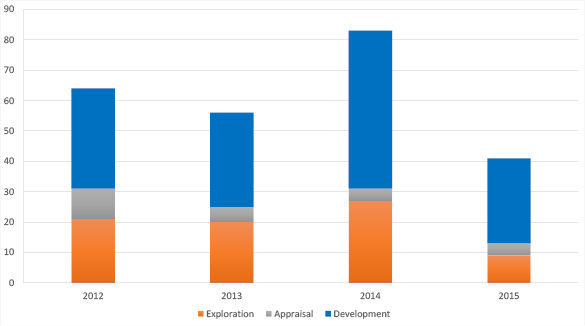
| Wells | 2014 | Mar-15 | Apr-15 | May-15 | Jun-15 | Jul-15 | Aug-15 |
|---|---|---|---|---|---|---|---|
| Commenced | 73 | 5 | 7 | 2 | 3 | 4 | 7 |
| In progress | 13 | 12 | 18 | 11 | 9 | 9 | 6 |
| Suspended | 14 | 11 | 12 | 21 | 10 | 15 | 18 |
| Completed | 83 | 4 | 2 | 1 | 14 | 3 | 7 |
Surveys Completed
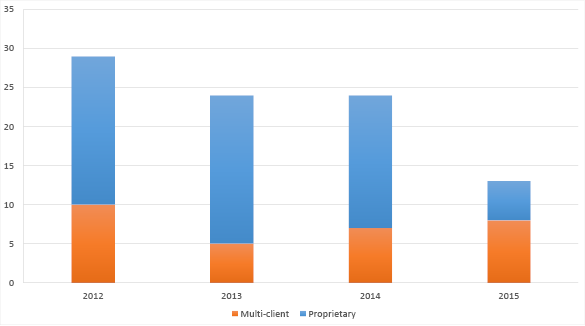
| Surveys | 2014 | Mar-15 | Apr-15 | May-15 | Jun-15 | Jul-15 | Aug-15 |
|---|---|---|---|---|---|---|---|
| Commenced | 24 | 2 | 2 | 1 | 4 | 2 | 0 |
| In progress | 4 | 4 | 3 | 2 | 2 | 2 | 2 |
| Suspended | 1 | 0 | 2 | 2 | 1 | 2 | 2 |
| Completed | 22 | 1 | 3 | 1 | 3 | 3 | 0 |
Data Submissions Outstanding (last six months)