NOPTA dashboard report—April 2015
Applications in progress
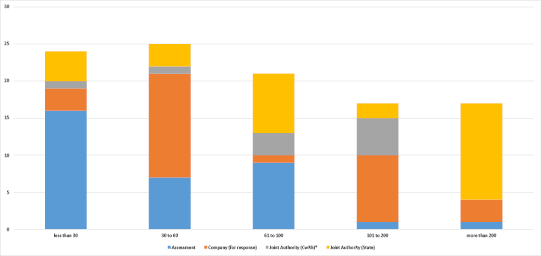
| Application Status | Less than 30 | 30 to 60 | 61 to 100 | 101 to 200 | more than 200 | Total |
|---|---|---|---|---|---|---|
| Assessment | 16 | 7 | 9 | 1 | 1 | 34 |
| Company (for response) | 3 | 14 | 1 | 9 | 3 | 30 |
| Joint Authority (Cwlth)* | 1 | 1 | 3 | 5 | 0 | 10 |
| Joint Authority (State) | 4 | 3 | 8 | 2 | 13 | 30 |
| Total | 24 | 25 | 21 | 17 | 17 | 104 |
Joint Authority for Decision
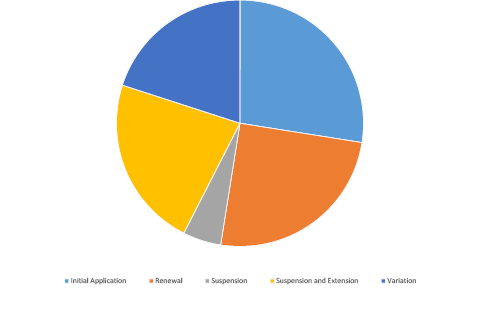
| Application Type | Joint Authority (Cwlth)* | Joint Authority (State) | Total |
|---|---|---|---|
| Initial Application | 3 | 8 | 11 |
| Renewal | 4 | 6 | 10 |
| Suspension | 0 | 2 | 2 |
| Suspension and Extension | 2 | 7 | 9 |
| Variation | 1 | 7 | 8 |
| Total | 10 | 30 | 40 |
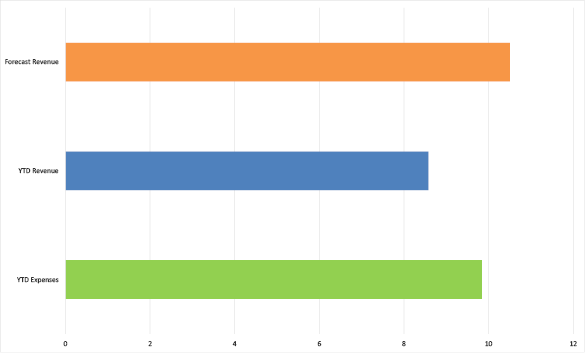
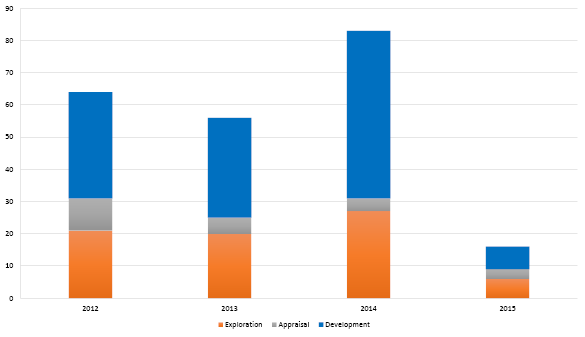
Finance $M
Completed Applications
| Decision Maker | In Progress | March 2015 Completed | Completed YTD |
|---|---|---|---|
| Applications for JA Decision | 87 | 25 | 69 |
| Applications for TA Decision | 11 | 3 | 140 |
| Commonwealth Minister (GHG) | 3 | 0 | 0 |
| Total | 101 | 28 | 209 |
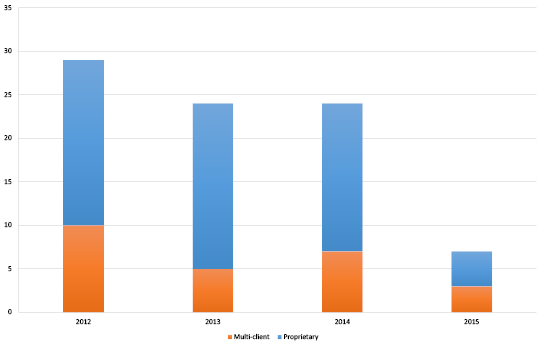
Data Submissions Outstanding April
| Activities | Less than 30 | 30 to 60 | 61 to 100 | 101 to 200 | more than 200 | Total |
|---|---|---|---|---|---|---|
| All Activities | 8 | 15 | 7 | 10 | 0 | 40 |
| All Wells | 0 | 0 | 0 | 0 | 0 | 0 |
| Wells (Basic) | 0 | 0 | 0 | 0 | 0 | 0 |
| Wells (Interp) | 0 | 0 | 0 | 0 | 0 | 0 |
| All Surveys | 8 | 15 | 7 | 10 | 0 | 40 |
| New Surveys (Basic) | 8 | 15 | 7 | 8 | 0 | 38 |
| New Surveys (Interp) | 0 | 0 | 0 | 2 | 0 | 2 |
Wells Completed
| Wells | 2014 | Jan-15 | Feb-15 | Mar-15 | Apr-15 |
|---|---|---|---|---|---|
| Commenced | 73 | 2 | 11 | 5 | 7 |
| In progress | 13 | 10 | 7 | 12 | 18 |
| Suspended | 14 | 12 | 10 | 11 | 12 |
| Completed | 83 | 5 | 5 | 4 | 2 |
Surveys Completed
| Surveys | 2014 | Jan-15 | Feb-15 | Mar-15 | Apr-15 |
|---|---|---|---|---|---|
| Commenced | 24 | 3 | 0 | 2 | 2 |
| In progress | 4 | 2 | 5 | 4 | 3 |
| Suspended | 1 | 0 | 0 | 0 | 2 |
| Completed | 22 | 3 | 0 | 1 | 3 |
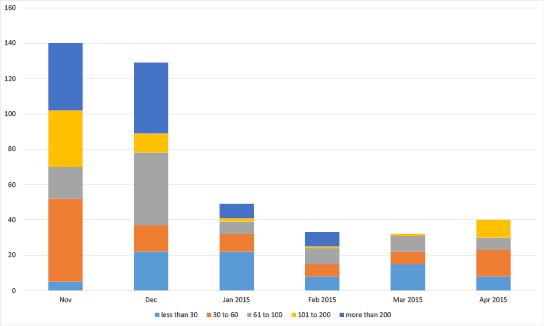
Data Submissions Outstanding (last six months)